View in English?
View in English?
View in English?
ハイコンテントスクリーニング (HCS) 、ハイコンテント解析 (HCA) の成功は、使用する試薬 (抗体) の品質、再現性に強く依存します。CSTの科学者は、社内でHCAを行い、免疫蛍光染色アプリケーションで推奨するCST抗体の開発と検証をしています。このため、スクリーニングアッセイでも安心してご利用いただくことができ、これにより時間とリソースを節約して、創薬プロジェクトの進行を効率化することができます。CSTは、ロット予約、バルク注文、溶液の組成変更にも対応しており、お客様のHCS/HCA実験全体を通して、一貫性の高い試薬のご提供が可能です。
免疫蛍光染色 (IF) 用に検証されたCSTの抗体はどれも、ハイコンテントスクリーニングで使用することができます。近年では翻訳後修飾 (PTM) に特異的な抗体や、トータル修飾基質を標的とする抗体など、IF推奨抗体のカタログは絶えず拡大しており、多くの疾患に関連したシグナル伝達経路の解析にご利用いただけます。HCS/HCAを用いた、標的発現、細胞内局在、またはPTM/活性化状態の測定のいずれにも対応するため、CST抗体は、薬物スクリーニングや疾患モデリング研究のための定量的エンドポイント解析を可能にします。
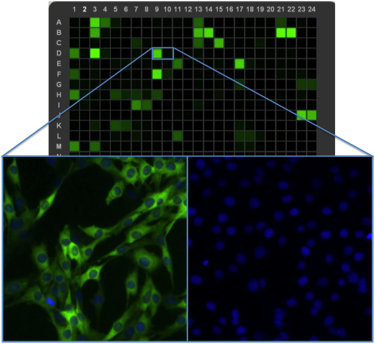
ハイコンテントイメージング (下) と組み合わせた、ハイスループットレーザーサイトメトリー (ヒートマップ、上) は、CSTのIF推奨抗体のすべての開発および製造試験のために極めて重要なツールです。
CSTの科学者は、社内での抗体検証にHCAを使用しています。
異なる生物学的スケール (リン酸化、転座、細胞内やスフェロイドなど) における、活性化への応答を定量的に評価する方法を紹介します。
View in English?